Prometheus,Node exporter, Alaert Manager and Grafana Setup

Hii I am a backend/DevOps engineer.I have a experience with development and automation.I mostly work with Python, django, Cloud based technologies.
Install Prometheus:
Prometheus:
Purpose: Prometheus is the core monitoring engine responsible for collecting and storing time-series data (metrics) from various sources.
How it Works: It scrapes metrics from instrumented jobs, stores them locally, and provides a powerful query language (PromQL) for analyzing and alerting on this data.
Key Features: PromQL, multi-dimensional data model, alerting rules, and a simple yet powerful architecture.
It is recommended to create a different user than root to run specific services. This will help to isolate Prometheus and add protection to the system.
sudo useradd --no-create-home prometheus

sudo mkdir /etc/prometheus

sudo mkdir /var/lib/prometheus
Now we need to install Prometheus.
wget https://github.com/prometheus/prometheus/releases/download/v2.19.0/prometheus-2.19.0.linux-amd64.tar.gz

tar xvfz prometheus-2.19.0.linux-amd64.tar.gz

sudo cp prometheus-2.19.0.linux-amd64/prometheus /usr/local/bin

sudo cp prometheus-2.19.0.linux-amd64/promtool /usr/local/bin/

sudo cp -r prometheus-2.19.0.linux-amd64/consoles /etc/prometheus

sudo cp -r prometheus-2.19.0.linux-amd64/console_libraries /etc/prometheus

sudo cp prometheus-2.19.0.linux-amd64/promtool /usr/local/bin/

rm -rf prometheus-2.19.0.linux-amd64.tar.gz prometheus-2.19.0.linux-amd64
Initially and as a proof of concept we can configure Prometheus to monitor itself. All what we need to do is create or replace the content of /etc/prometheus/prometheus.yml.
global:
  scrape_interval: 15s
  external_labels:
    monitor: 'prometheus'


scrape_configs:
  - job_name: 'prometheus'
    static_configs:
      - targets: ['localhost:9090']
To add a new server to scrape metrics using Prometheus, you need to extend the scrape_configs section in your Prometheus configuration file. Here's an example of how you can add a new target: /etc/prometheus/prometheus.yml.
scrape_configs:
  - job_name: 'prometheus'
    static_configs:
      - targets: ['localhost:9090']

  - job_name: 'prometheus'
    static_configs:
      - targets: ['server-ip:9100']
But before add the new server we have to install node-exporter on the server once it is done we can add the server inside the prometheus.yml file.
We might want Prometheus to be available as a service. Every time we reboot the system Prometheus will start with the OS. Create /etc/systemd/system/prometheus.service and add to it the following content:
[Unit]
Description=Prometheus
Wants=network-online.target
After=network-online.target
[Service]
User=prometheus
Group=prometheus
Type=simple
ExecStart=/usr/local/bin/prometheus \
    --config.file /etc/prometheus/prometheus.yml \
    --storage.tsdb.path /var/lib/prometheus/ \
    --web.console.templates=/etc/prometheus/consoles \
    --web.console.libraries=/etc/prometheus/console_libraries
[Install]
WantedBy=multi-user.target
Let’s change the permissions of the directories, files and binaries we just added to our system.
sudo chown prometheus:prometheus /etc/prometheus
sudo chown prometheus:prometheus /usr/local/bin/prometheus
sudo chown prometheus:prometheus /usr/local/bin/promtool
sudo chown -R prometheus:prometheus /etc/prometheus/consoles
sudo chown -R prometheus:prometheus /etc/prometheus/console_libraries
sudo chown -R prometheus:prometheus /var/lib/prometheus
Now we need to configure systemd
sudo systemctl daemon-reload
sudo systemctl enable prometheus
sudo systemctl start prometheus
Good job, now we have everything in place but the setup is not complete, we need metrics to feed our brand new Prometheus instance. In the next section we will learn how to setup a node exporter.
Prometheus Node Exporter:
Node Exporter:
Purpose: Node Exporter is an exporter for machine-level metrics. It collects various system-level metrics from a server or node.
How it Works: Node Exporter exposes metrics related to CPU usage, memory, disk I/O, network statistics, and more. Prometheus scrapes these metrics from the Node Exporter's HTTP endpoint.
Key Features: Provides a standardized way to collect machine-level metrics for monitoring.
Now let’s create a user for Prometheus Node Exporter.
sudo useradd --no-create-home node_exporter
We are ready to install Node Exporter binaries.
wget https://github.com/prometheus/node_exporter/releases/download/v1.0.1/node_exporter-1.0.1.linux-amd64.tar.gz
tar xzf node_exporter-1.0.1.linux-amd64.tar.gz
sudo cp node_exporter-1.0.1.linux-amd64/node_exporter /usr/local/bin/node_exporter
rm -rf node_exporter-1.0.1.linux-amd64.tar.gz node_exporter-1.0.1.linux-amd64
Configure a service. Create /etc/systemd/system/node-exporter.service if it doesn’t exist.
[Unit]
Description=Prometheus Node Exporter Service
After=network.target

[Service]
User=node_exporter
Group=node_exporter
Type=simple
ExecStart=/usr/local/bin/node_exporter

[Install]
WantedBy=multi-user.target
Configure systemd.
sudo systemctl daemon-reload
sudo systemctl enable node-exporter
sudo systemctl start node-exporter
sudo systemctl status node-exporter
Configure Prometheus Server
Now we need to go back to the first AWS EC2 instance where we installed Prometheus and change its configuration to start receiving metrics from the Node Exporter we just installed and configured.
- Edit
/etc/prometheus/prometheus.ymlfile.
global:
  scrape_interval: 15s
  external_labels:
    monitor: 'prometheus'

scrape_configs:
  - job_name: 'node_exporter'
    static_configs:
      - targets: ['<server-public-ip>:9100']
- Restart Prometheus service.
sudo systemctl restart prometheus
Try It Out
Now in your browser navigate to http:<server-ip>:9090/targets . Remember to change the url accordingly to your Prometheus AWS EC2 instance details and you should see something similar to this:

Install Alertmanager
Alertmanager:
Purpose: Alertmanager is responsible for handling alerts sent by Prometheus and managing the alerting workflow.
How it Works: It deduplicates, groups, and routes alerts to different receivers (such as email, Slack, or other integrations). It also handles silencing, inhibition, and other advanced alert management features.
Key Features: Centralized alert management, silencing, grouping, and integration with various notification channels.
Install Alertmanager.
wget https://github.com/prometheus/alertmanager/releases/download/v0.21.0/alertmanager-0.21.0.linux-amd64.tar.gz
tar xvfz alertmanager-0.21.0.linux-amd64.tar.gz

sudo cp alertmanager-0.21.0.linux-amd64/alertmanager /usr/local/bin
sudo cp alertmanager-0.21.0.linux-amd64/amtool /usr/local/bin/
sudo mkdir /var/lib/alertmanager

rm -rf alertmanager*
Add Alertmanager’s configuration for slack notification
/etc/prometheus/alertmanager.yml.Create a slack chanel.
Login to Slack:
- If you don't have a Slack workspace, create one and log in.
Create a Channel:
- Create a new channel or use an existing one where you want to receive Prometheus alerts.
Create Incoming webhook: Go to https://app.slack.com/. Search incoming webhook inside the search directory. Click on Add to slack. Choose a chanel. Then click on add incoming webhook integration. Copy the webhook url and paste it to the alertmanager.yml.
Add Alertmanager’s configuration /etc/prometheus/alertmanager.yml.
global:
    global:
      resolve_timeout: 5m
      slack_api_url: 'webhook-url'

    route:
      group_wait: 1m
      group_interval: 1m
      receiver: 'slack-notifications'

    receivers:
    - name: 'slack-notifications'
      slack_configs:
      - channel: '#prometheus-alerts'
        send_resolved: true
- Add Alertmanager’s configuration for emil notification
/etc/prometheus/alertmanager.yml.
global:
  resolve_timeout: 5m

route:
  receiver: 'gmail-notifications'

receivers:
- name: 'gmail-notifications'
  email_configs:
  - to: 'email you want to send email to’  # Replace with the actual recipient email address
    from: 'email'
    smarthost: 'smtp-relay.brevo.com:587'
    auth_username: 'email’'
    auth_identity: 'email’'
    auth_password: 'enter-password’'
    send_resolved: true
- Configure Alertmanager as a service.
/etc/systemd/system/alertmanager.service
[Unit]
Description=Alert Manager
Wants=network-online.target
After=network-online.target

[Service]
Type=simple
User=prometheus
Group=prometheus
ExecStart=/usr/local/bin/alertmanager \
  --config.file=/etc/prometheus/alertmanager.yml \
  --storage.path=/var/lib/alertmanager

Restart=always

[Install]
WantedBy=multi-user.target
- Configure Systemd
sudo systemctl daemon-reload
sudo systemctl enable alertmanager
sudo systemctl start alertmanager
Create a Rule
This is just a simple alert rule. In a nutshell it alerts when an instance has been down for more than 3 minutes. Add this file at /etc/prometheus/rules.yml.
groups:
- name: AllInstances
  rules:
  - alert: ServerDown
    # Condition for alerting
    expr: up == 0
    for: 3m
    # Annotation - additional informational labels to store more information
    annotations:
      title: 'Instance {{ $labels.instance }} down'
      description: '{{ $labels.instance }} of job {{ $labels.job }} has been down for more than 1 minute.'
    # Labels - additional labels to be attached to the alert
    labels:
      severity: 'critical'
This Prometheus alert rule is designed to trigger an alert named "HighCPUUsage" when the CPU usage on a server exceeds 80% for more than 1 minute.
create a file cpu_rule.yml
groups:
- name: "High CPU Usage On Kafka Instance"
  rules:
  - alert: "High CPU Usage On Kafka Instance"
    # Condition for alerting
    expr: 100 - (avg by (instance) (rate(node_cpu_seconds_total{job="aws-ec2-kafka-jdbc",mode="idle"}[1m])) * 100) >= 75
    for: 1m
    # Annotation - additional informational labels to store more information
    annotations:
      title: 'High CPU Usage on Instance {{ $labels.job }}'
      description: 'Instance {{ $labels.instance }} has CPU Usage over 75% for more than 1 minute. Current Value is {{ $value | printf "%.2f"}}'
    # Labels - additional labels to be attached to the alert
    labels:
      severity: 'critical'
Configure Prometheus
- Let’s change the permissions of the directories, files and binaries we just added to our system.
sudo chown -R prometheus:prometheus /etc/prometheus
- Update Prometheus configuration file. Edit
/etc/prometheus/prometheus.yml.
global:
  scrape_interval: 1s
  evaluation_interval: 1s

rule_files:
 - /etc/prometheus/rules.yml
 - /etc/prometheus/cpu_rule.yml

alerting:
  alertmanagers:
  - static_configs:
    - targets:
      - localhost:9093

scrape_configs:
  - job_name: 'prometheus'
    static_configs:
      - targets: ['localhost:9090']

  - job_name: 'prometheus'
    static_configs:
      - targets: ['server-ip:9100']
- Reload Systemd
sudo systemctl restart prometheus
Try It Out
- Turn off the Node Exporter AWS EC2 Instance

Wait for 3 minutes and check the Alertmanager URL that is installed in your
prometheus-serverinstance:http://server-ip:9093/#/alerts. As always, remember that you need to use a different URL depending on your AWS EC2 instance details.Check your slack and email you got alert.
Grafana Setup
Grafana:
Purpose: Grafana is a popular open-source platform for visualizing and analyzing metrics. It integrates with various data sources, including Prometheus.
How it Works: Grafana allows users to create dashboards with customizable panels that visualize data from Prometheus and other sources. It supports querying, alerting, and sharing dashboards.
Key Features: Rich visualization options, dashboard sharing, alerting, and support for various data sources.
Install the prerequisite packages:
$ sudo apt-get install -y apt-transport-https software-properties-common wget
Import the GPG key:
$ sudo mkdir -p /etc/apt/keyrings/

$ wget -q -O - https://apt.grafana.com/gpg.key | gpg --dearmor | sudo tee /etc/apt/keyrings/grafana.gpg > /dev/null
To add a repository for stable releases, run the following command:
$ echo "deb [signed-by=/etc/apt/keyrings/grafana.gpg] https://apt.grafana.com stable main" | sudo tee -a /etc/apt/sources.list.d/grafana.list
Run the following command to update the list of available packages:
# Updates the list of available packages
$ sudo apt-get update
To install Grafana OSS, run the following command:
# Installs the latest OSS release:
sudo apt-get install grafana
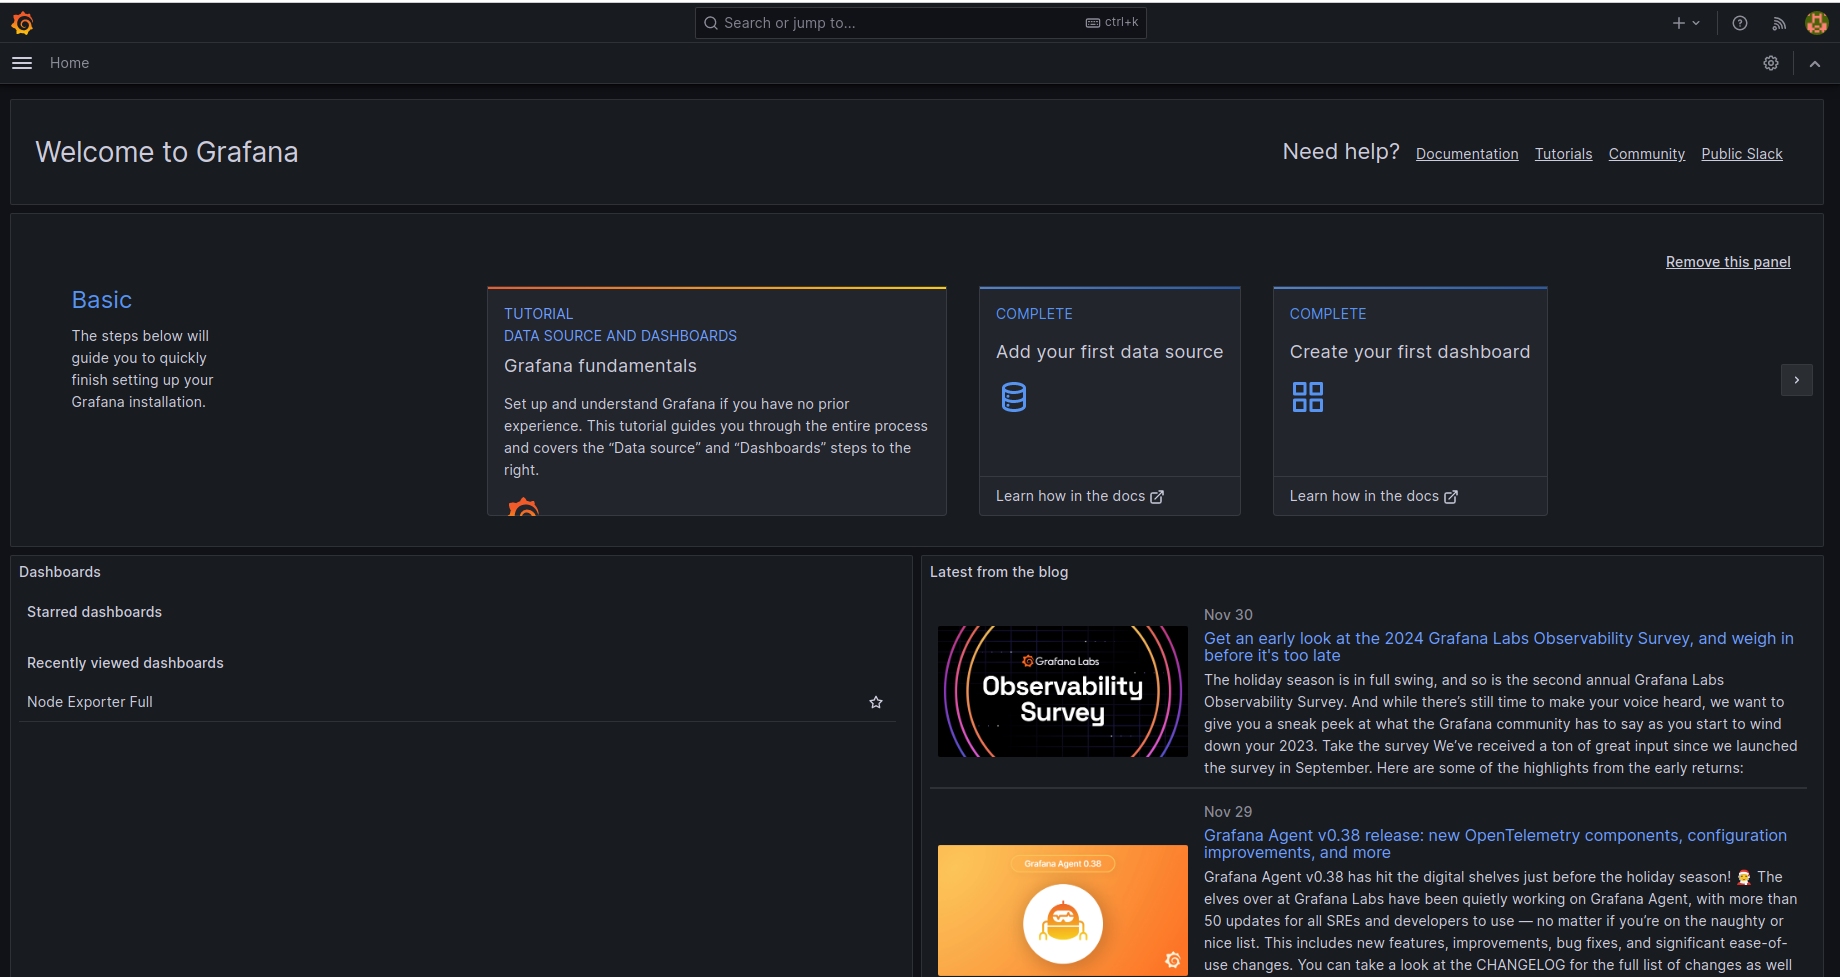
Go to browser: http://ip:3000
Username: admin, password: admin
ones it is done search data source > add new data source (Prometheus)
Add Prometheus server URL (http://ip:9090) then click on save and test.
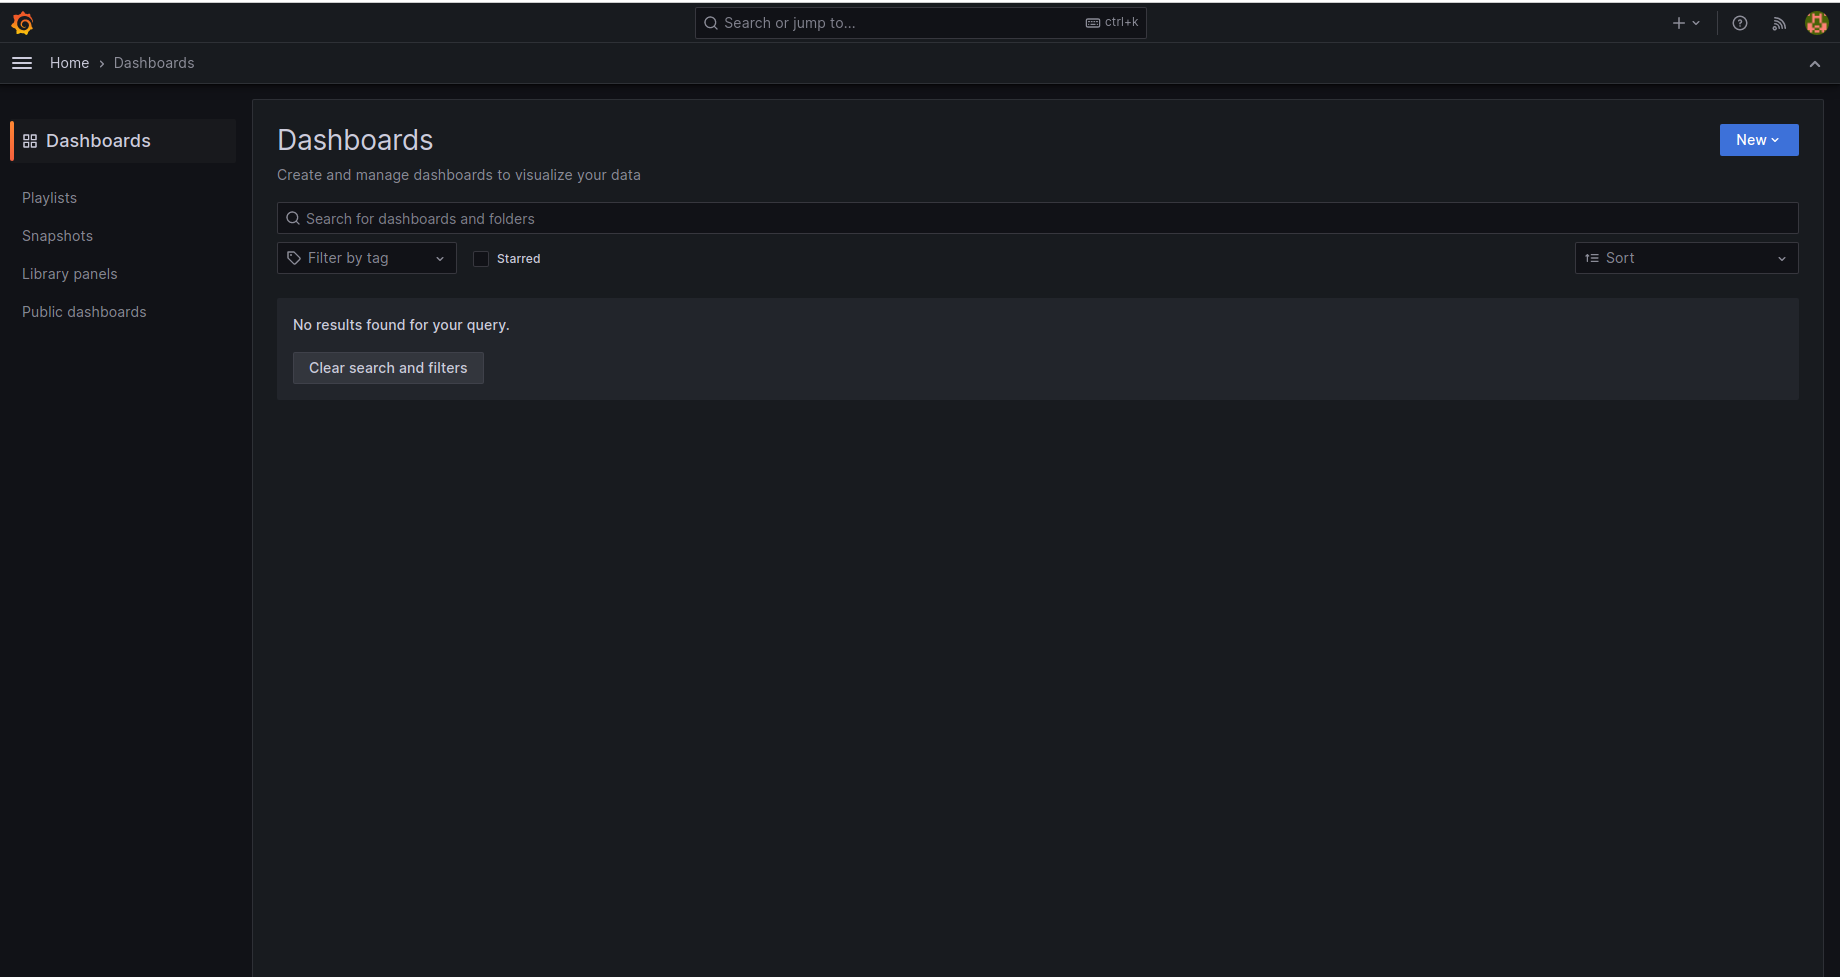
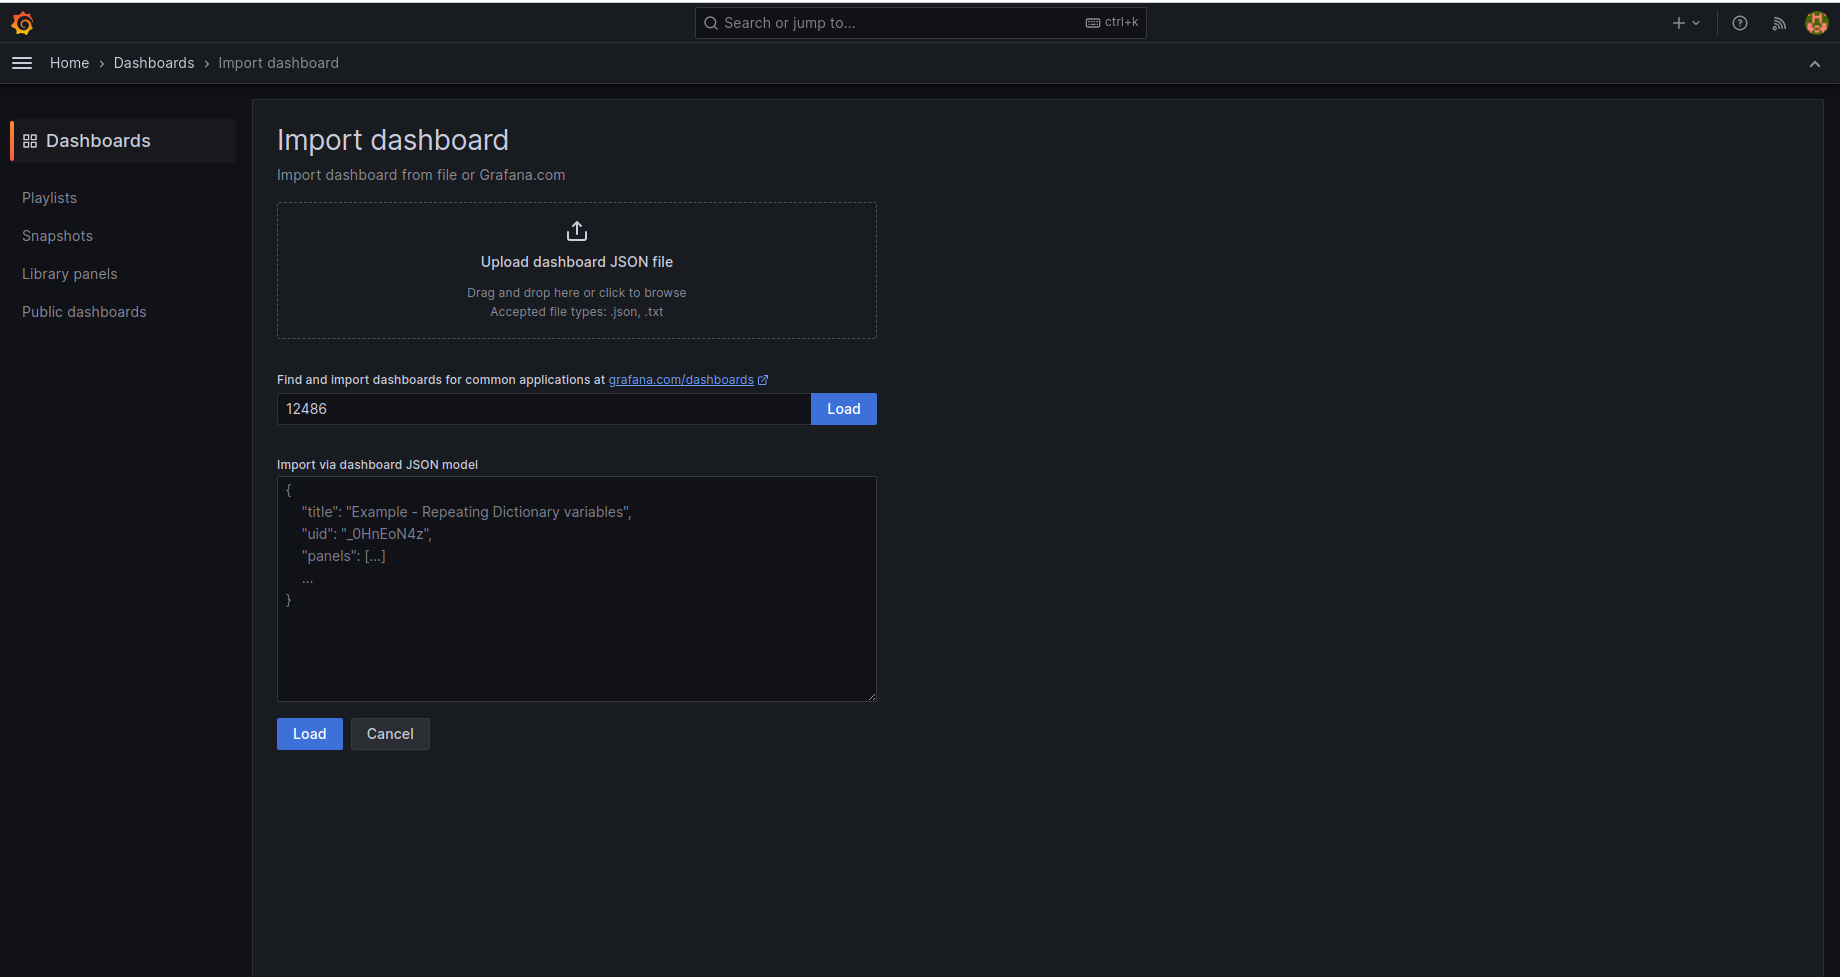
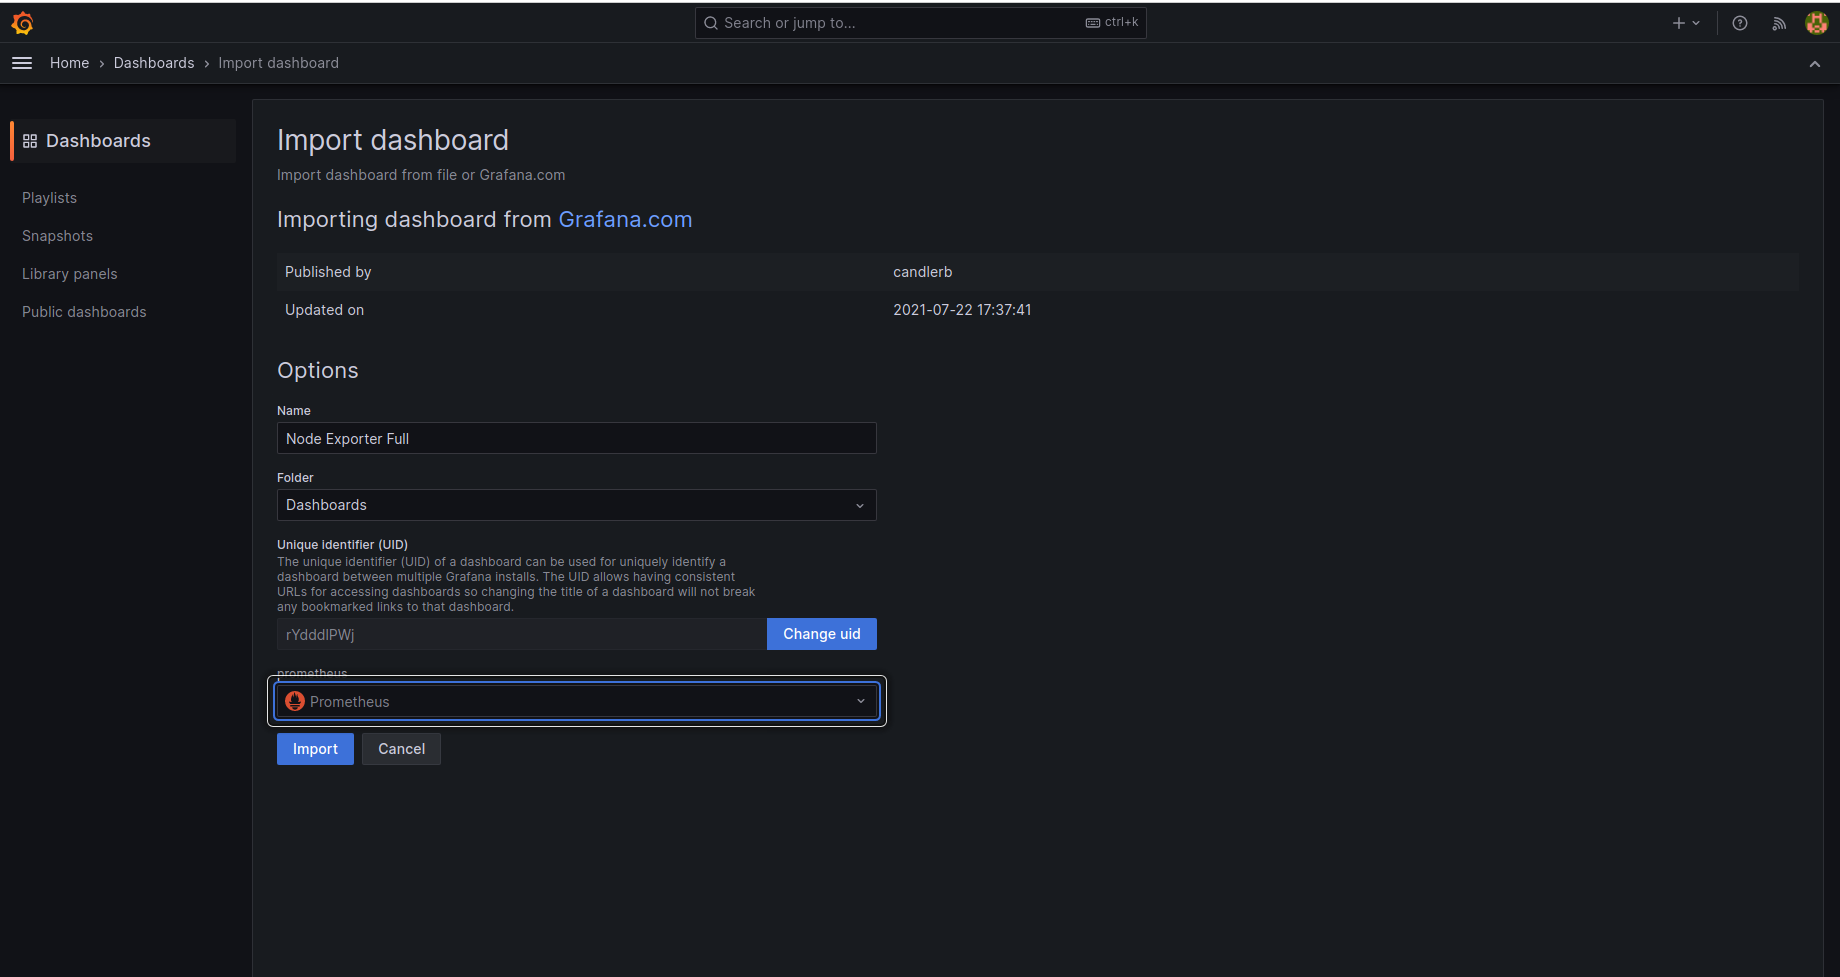
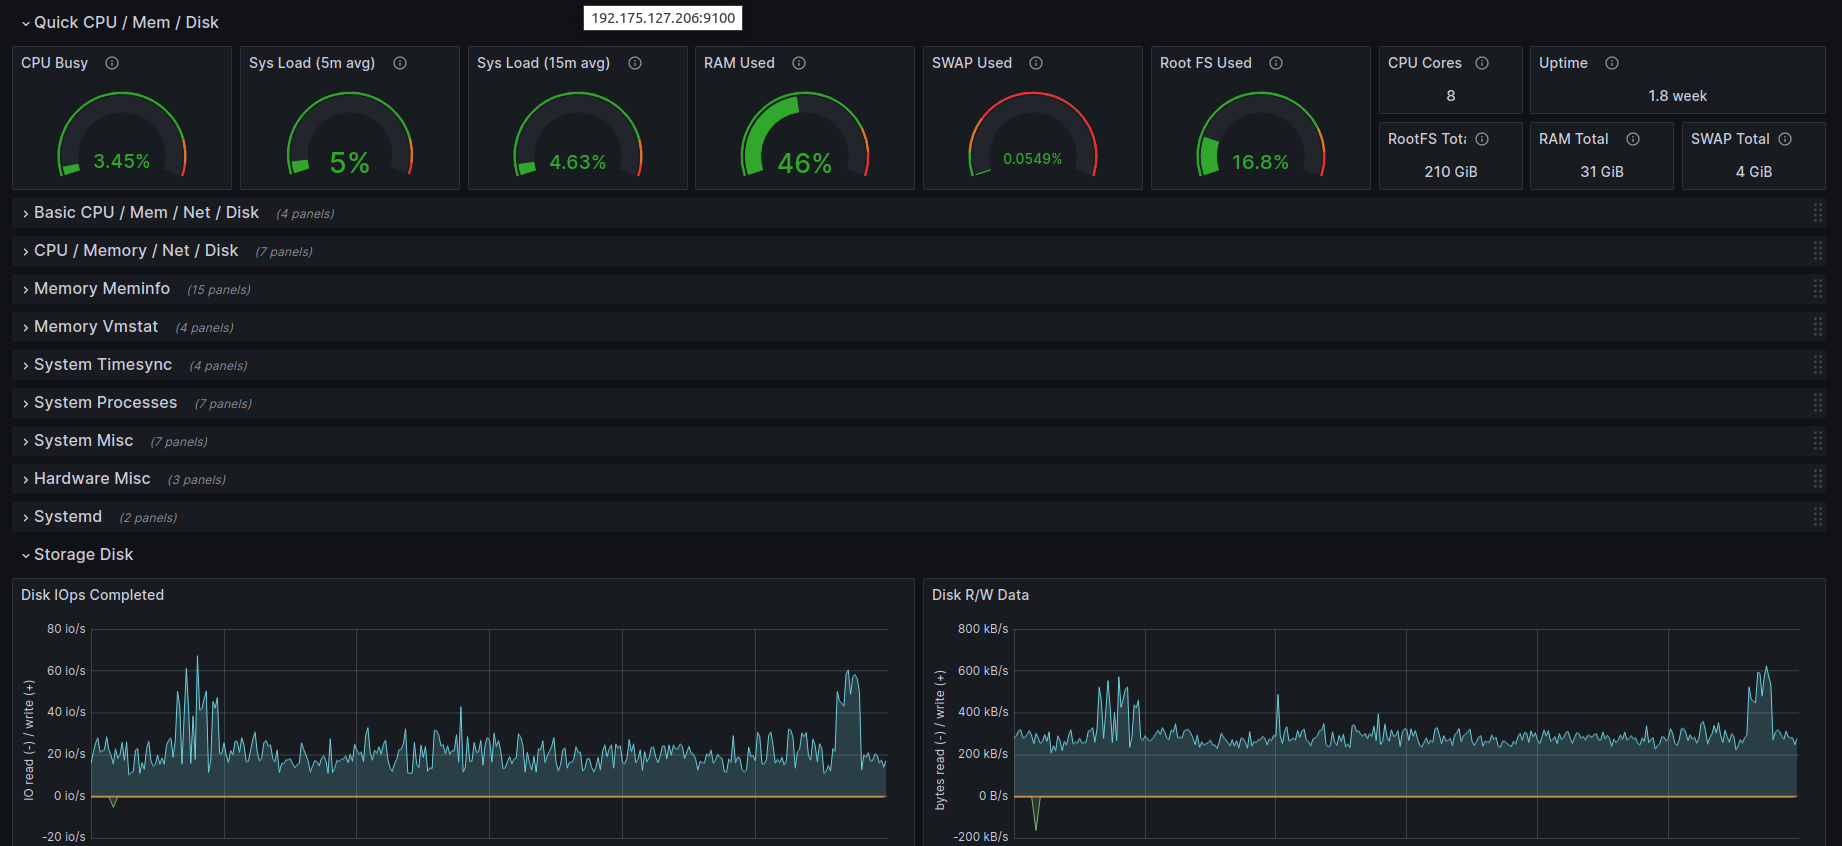
ones it is done search the import dashboard New > import put id (12486) and click on load and then select a data source (prometheus) click on import.